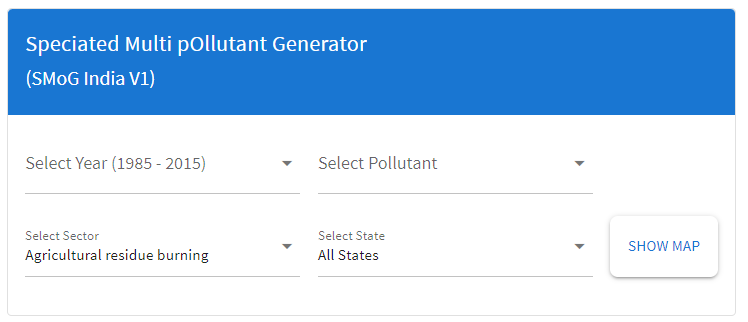
Speciated Multi pOllutant Generator
(SMoG India V1)
{{ emptydata }}
{{ emptydata }}
{{ emptydata }}
{{ emptydata }}
Help
SMoG Visualisation Interface
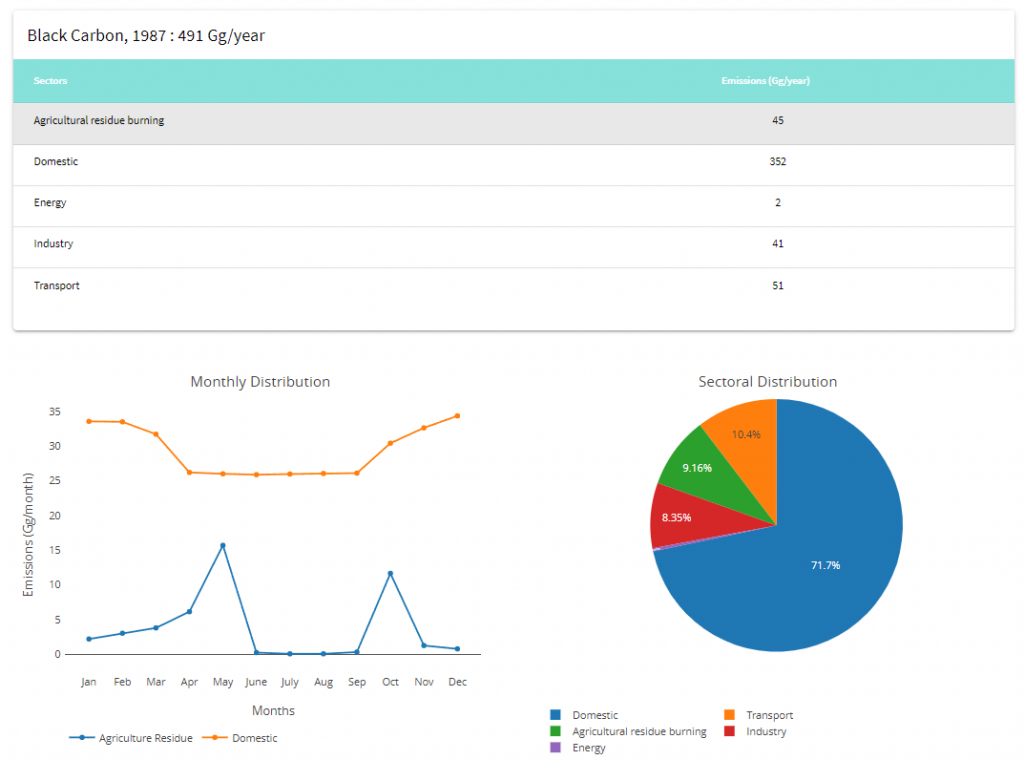
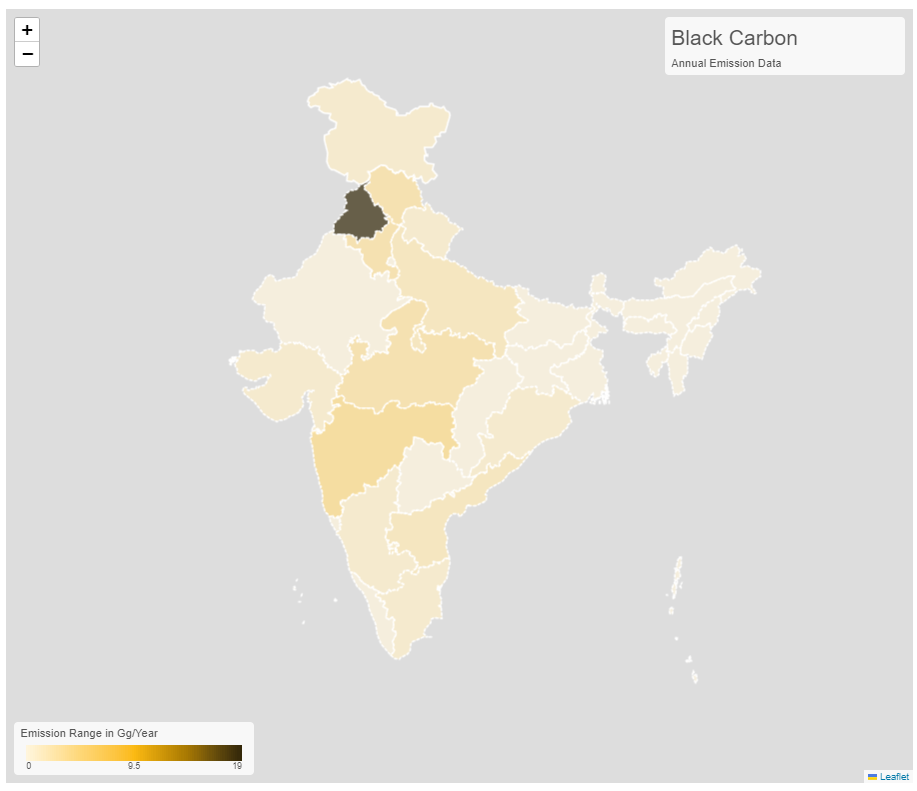
The page displays the analysis/distribution of a pollutant for specific time frame in a region.
Usage:
- To display a detailed analysis, first select a year from the "Select Year" dropdown.
- Then click on "Select Pollutant" dropdown and select one.
- Then select a sector from "Select Sector" field.
- Finally, select a state from "Select State" field.
- Click on "Show Map" button.
- The whole available data will get displayed in the form of graphs and India map.